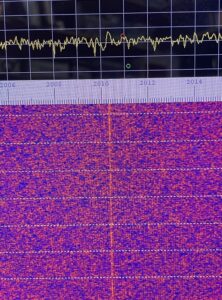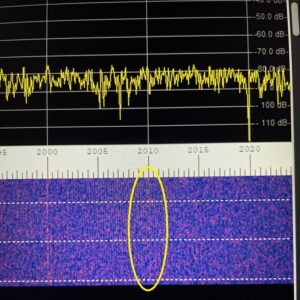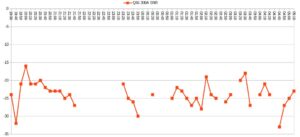
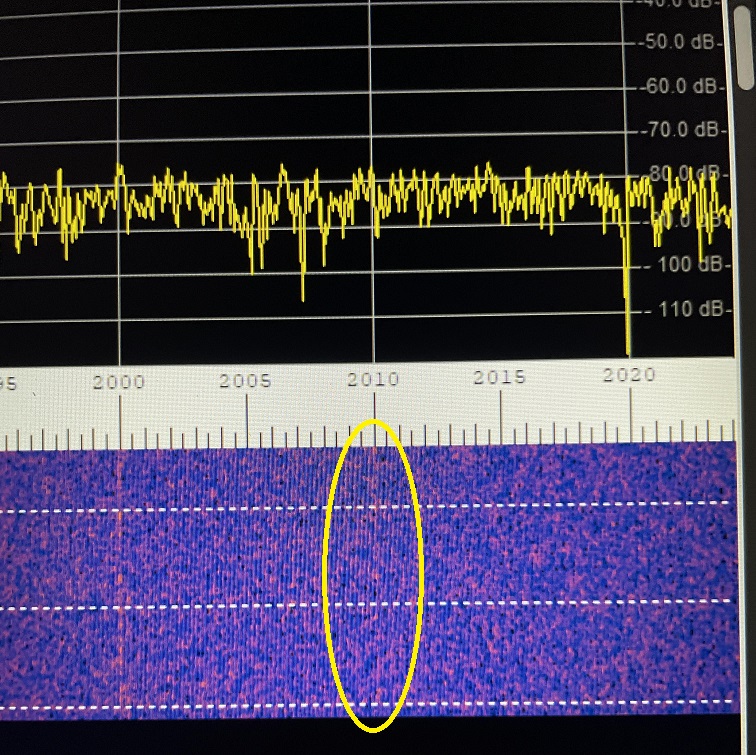
Here’s Bernd’s signal received in DFCW mode on 8270.030...

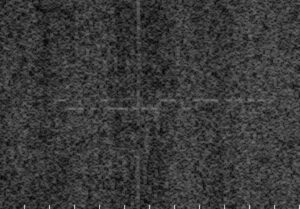
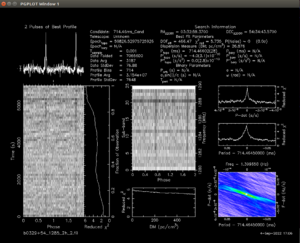
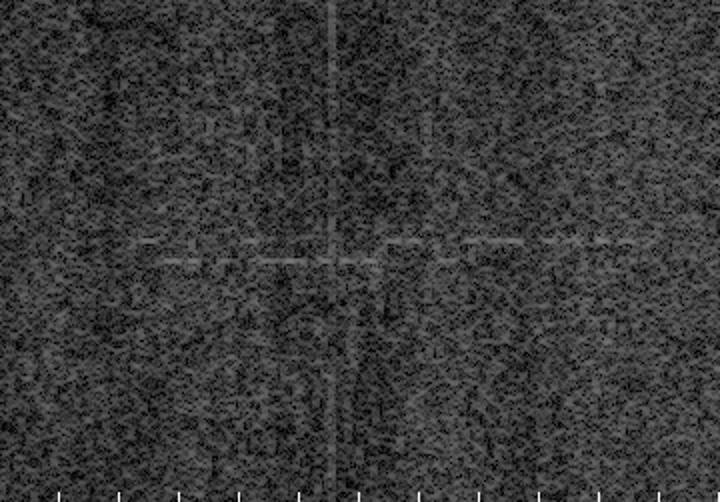
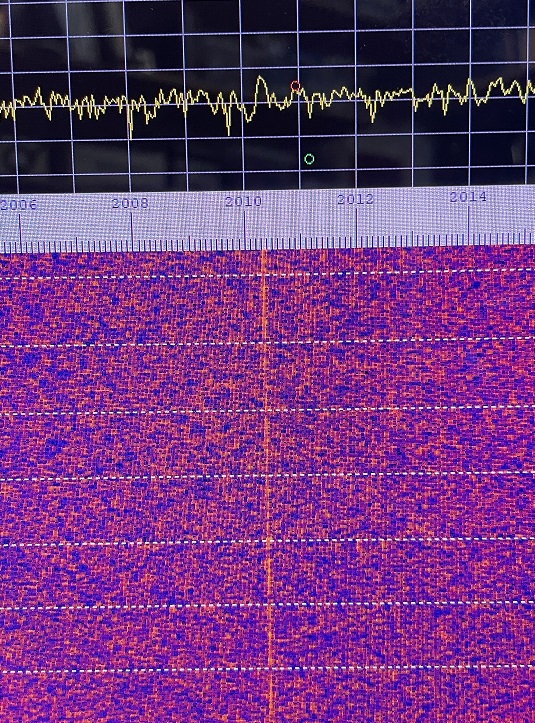
This is another ultimate Dx challenge! A pulsar is...
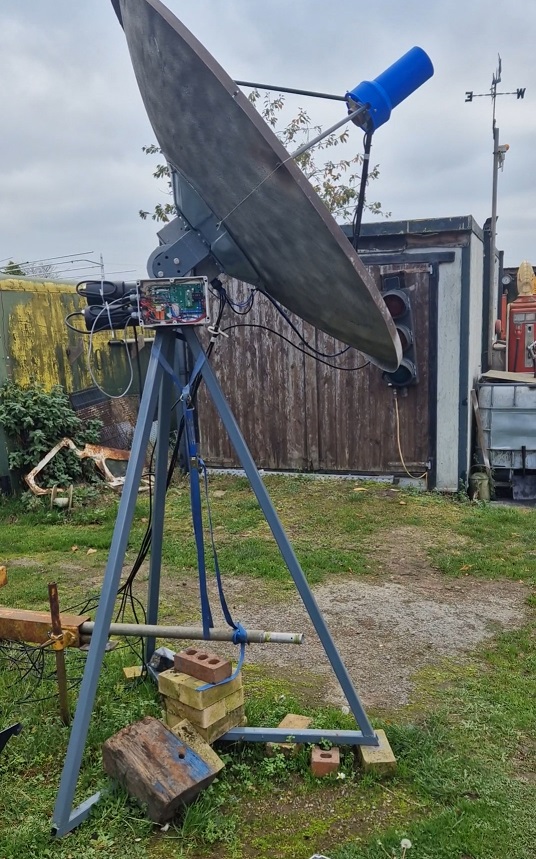
This has fascinated me for a long time, it’s...
On 22nd Feb 2026 Clive and myself performed another...
On Thursday Evening 29th Jan 2026 we performed another...
On New Years Eve 2025 Clive and myself ran...
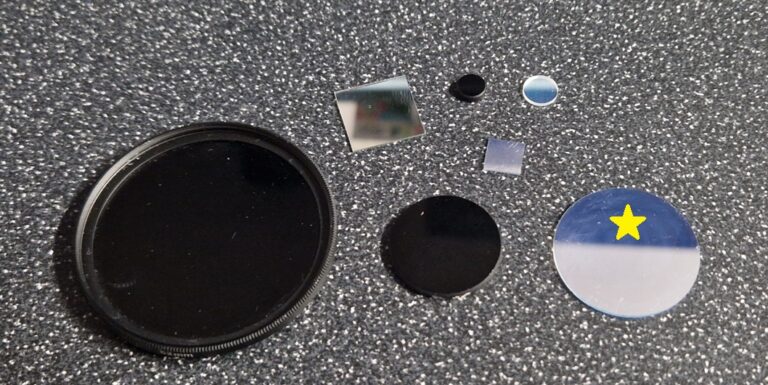
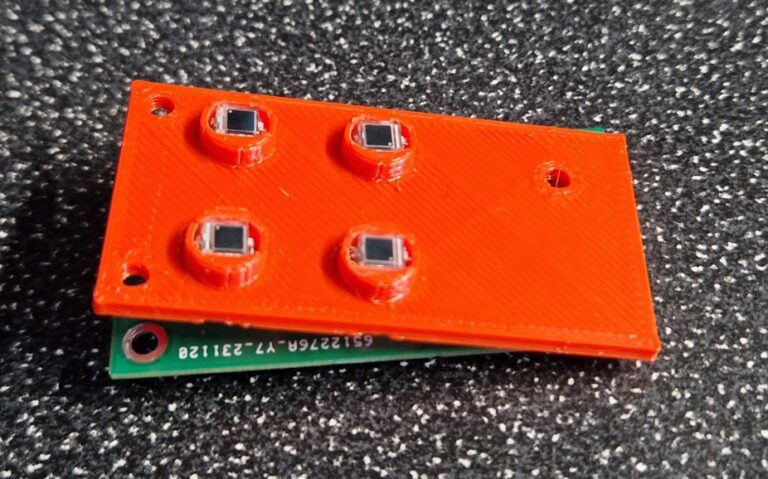
As it’s optical season I finally got round to...
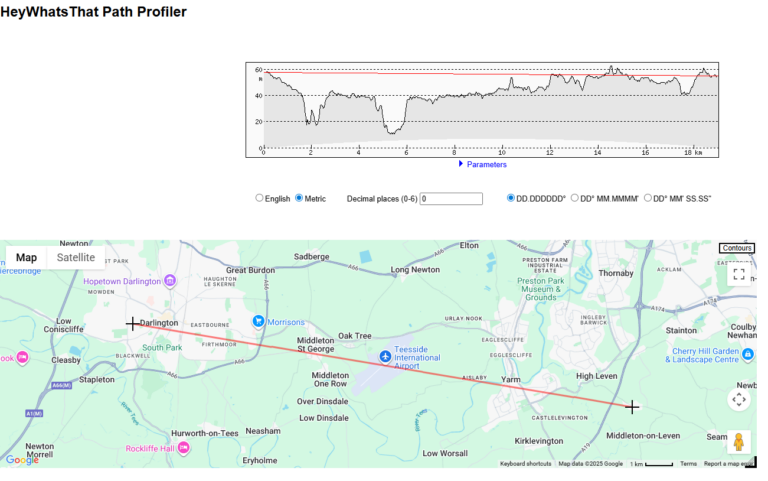
This is the latest test with my non line...
On the night of 13th December 2025 Clive G4FVP...
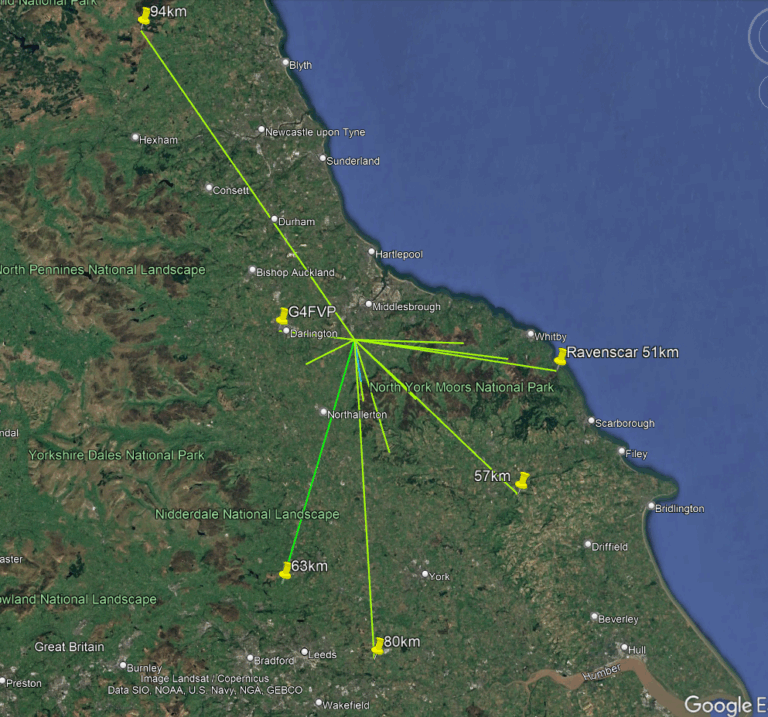
Last Update – 29/12/2024 Here’s a map of the...